Achievement Gap Adds Urgency To The Task
Regular listeners to Garrison Keillor’s “A Prairie Home Companion” may have the mistaken impression that there is a less urgent need to change and improve public education in Minnesota. At least in mythical Lake Webegon, “all children are above average.” Aside from the statistical impossibility of such a claim, “tain’t so.”
It is true that, using aggregate and average testing and other student performance data, Minnesota continues to look very good when compared with other states. Our students score well on the National Assessment of Educational Progress (NAEP) tests, as well as the ACT, SAT, Advance Placement and International Baccalaureate tests, all taken by students who are headed for college.
But, one of Minnesota’s family secrets is that Minnesota has huge and unacceptable gaps in achievement levels and high school graduate rates among its increasingly diverse communities.
According to the Center on Education Policy, the state has the largest achievement difference between African-American and white students among the 19 states that require graduation exams. The Center notes that 78 percent of Minnesota white students passed the math portion of the state’s eighth-grade basis skills test on the first try, compared with 33 percent of the black students. And, the rate at which black student pass the reading portion of the eight-grade basis skills test lags 38 percentage points behind white students.
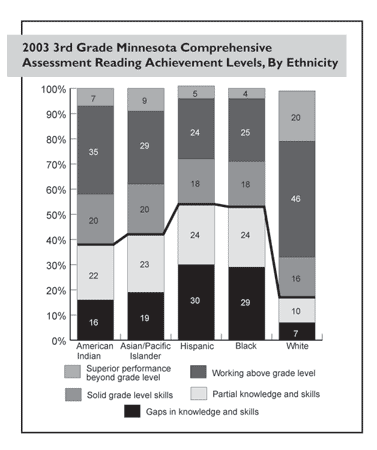
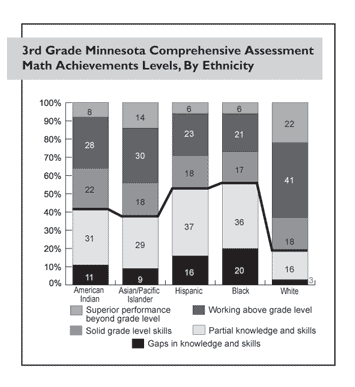
The Minnesota Minority Education Partnership (MMEP) recently issued a report further documenting these gaps across a number of different racial and ethnic groups in the state. The graphs above show the differences among students of various racial groups on the state’s third grade standardized tests for both reading and math.
In math, for example, 63 percent of white students in the state exhibited either “superior performance beyond grade level” or “solid grade level skills,” while the percentage totals in those two categories for American Indian students was 36 percent; 44 percent for Asian/Pacific Islander students; 29 percent for Hispanics and 27 percent for Black students. For third grade reading, the percentages of students in these two top categories was 66 percent for white student, 42 percent for American Indians, 28 for Asian/Pacific Islanders and 29 percent for both Hispanic and Black students.
The MMEP report documents similar gaps in high school completion and college attendance rates. In 2001, for example, the Minnesota Department of Education found 39 percent of black students graduated in four years, compared to 43 percent of American Indian Students, 47 percent of Hispanic students, 68 percent of Asian students and 83 percent of Whites.
The MMEP argues that the urgency to address these disparities is growing as the percentage of the state’s population in lower-performing demographic groups continues to grow. And the MMEP notes that — with huge percentages increases in non-white populations now living in selected suburbs and rural communities — these gaps in student achievement are no longer a concern only in Minneapolis and St. Paul.